

FunnelFLARE users can easily run sales reports to check in on activity, analyze campaign/sequence performance, and gain insights into their prospects.
Reporting in FunnelFLARE occurs in Dashboards and one-time or scheduled email reports. We recommend dashboards for users who are frequently on the platform and require live, up-to-date information. For users who aren’t in the platform often, stakeholders in different groups, or for users who can’t remember logins, scheduled email reports are the better choice.
SDRs, Account Managers, and Sales Managers are more likely to use dashboards, while VPs, marketing, and other stakeholders will appreciate an automatic daily, weekly, or monthly email with just the KPIs they care about. Dashboards and scheduled emails use report widgets, so let’s take a look at some commonly used widgets.
This is not an exhaustive list of reports; it’s just a sample. Schedule a demo with us to see specific reports.
FunnelFLARE Report Widgets
The Map Widget shows prospect activity in a map format. You can further filter what kind of activity to show between appointments scheduled, website visits, email link clicks, email opens, and asset downloads.

Sales Phone Call Reports
Many of FunnelFLARE’s customers are focused on making calls and FunnelFLARE offers some practical reports to help gain insight into what’s going on.
Calls by day of the week can help show if your SDRs or outbound callers are losing steam mid-week.

If you name your tracking phone numbers after the salesperson using them, you can very easily report on those numbers as their activity.

Appointments
With FunnelFLARE’s built-in appointment scheduling, you can view company-wide appointments or a salesperson could see just their own appointments. This is a quick way of seeing what’s coming up or who’s busy.

Phone Call Recording
Recording phone calls offers great visibility into sales performance and lets sales managers perform quality control. FunnelFLARE offers easy access to useful phone call recording reports like:
- Recent phone call recordings
- Filter by phone call name/phone number
- Filter by phone call keywords


Email Sequence Reporting
For commonly used sequences that are constantly being tweaked for better performance, FunnelFLARE offers reporting on:
- How many total contacts are in that sequence or email drip
- How many of each type of email has been sent out
- Email open and click rates for each email, unsubscribes, goal conversions, etc

The drip campaign report is a report that you can run at any time that offers a deep dive into drip campaign performance. You can see the totals of participants, sends, etc, and you can also see rates: click rate, open rate, conversion rate.

Organization
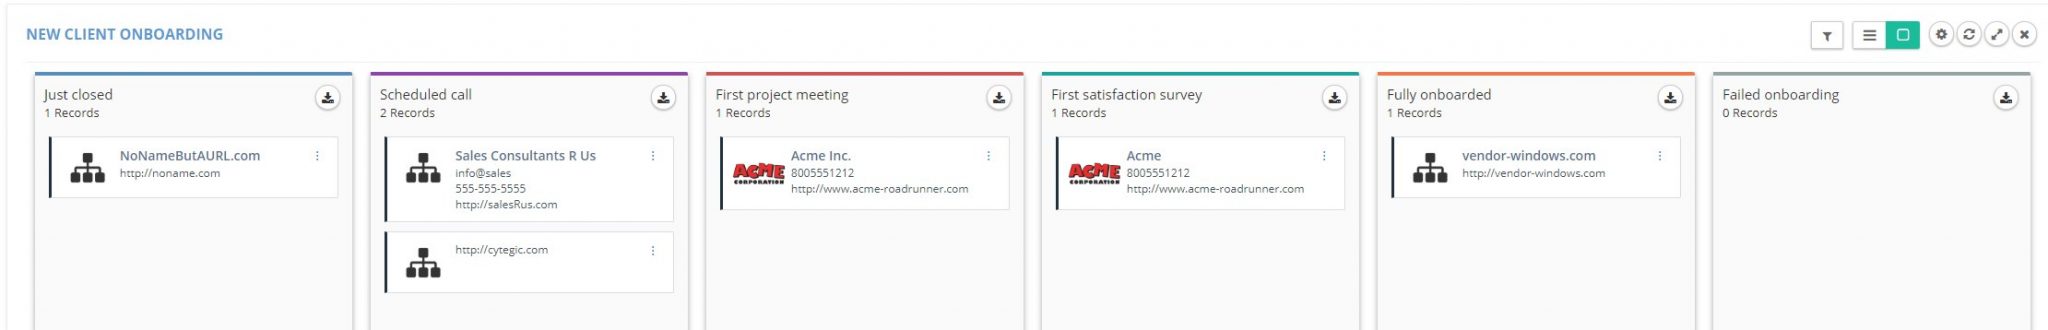
FunnelFLARE can store your contacts and organizations inside the platform, and you can also categorize them by custom fields and report on how many contacts and organizations are in those different categories. This makes it easy to see what’s going on at a glance. Because you can add segments to each of these, you can create kanban style boards for individual sales reps. Read more about account kanbans here.

Another way to organize and view prospects is by using the funnel visualization. This shows where different contacts are based on a custom field that you define.

Incoming Visitors
In addition to the FunnelFLARE chrome extension that can alert you when prospects are active, there are also widgets that show visitors on your website. You can see these as companies that have visited over a certain time period, or by seeing who’s on your website in real-time, even anonymous users.

Conclusion
FunnelFLARE offers a variety of different report widgets that can be used in dashboards and in schedule reporting emails. If you want to see what our reports can do, or if you have specific questions, schedule a demo with us today and we’d be happy to help.


